
Tangible Assets 2

Summary: I was happy to see that the Tangible Assets piece I posted several days ago was viewed by almost 10,000 people and generated interesting discussions and questions among subscribers here on the newsletter site. I decided to dig a little deeper and explain why I have been so interested in the economy’s balance sheet and give you a first look at its composition.
Two-Cylinder Economy
I decided forty years ago that every economy has two cylinders, not one, and that both cylinders have to be working properly to achieve the best outcome. One cylinder—the one everybody writes about—is represented by an economy’s national income accounts. This is the economy that everybody writes about. You can think of this production economy as a country’s profit and loss statement. It measures what you are doing, not what you own. We measure it by tracking activity (transitive verb), things like GDP, output, employment, incomes, and spending. GDP is currently running about $21 trillion per year. I say running because this economy measures the rate of flows over time, using units of dollars per year.
The second cylinder is represented by an economy’s balance sheet. It measures the values of our assets (with apologies to George Carlin, assets are the “stuff” we have accumulated over time), liabilities (how much money we owe each other or outsiders), and net worth (the difference between the two.) We measure it by tracking the value of stocks (piles) of things with dollars at a point in time, not as a flow of dollars per unit of time, like GDP. Lots of people write about pieces of the balance sheet, like stock markets or real estate but very few people think about it as the overall balance sheet.
The reason it is important to track both cylinders is they behave very differently. You need two different price theories—Stigler for one, Tobin for the other—to understand them. Their price actions are very different—slow and smooth (Gaussian) for one, sudden, erratic and fat-tailed (power law distribution) for the other. And one of them is really huge compared to the other one.
That Thing is Huge
We’ll leave the historical reasons for the economics profession’s unfortunate obsession with output and employment to a later article. For now, let’s just look at why size matters when thinking about macroeconomies.
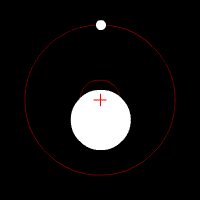
When I am talking with the students in my macro class the first question I ask them is “Why does the earth orbit the sun and not the other way around?” “That’s easy,” they say, “the earth orbits the sun because the sun is a lot bigger!”
There is always one student in the class who was a physics major who tells everyone they are wrong. The statement that the earth orbits the sun isn’t quite accurate. In fact, both the earth and the sun orbit the barycenter—roughly the center of gravity, or fulcrum, of the earth-sun system. The barycenter is marked with a red + in the graphic above. (More on barycenters in dynamical systems in a later post on China/U.S. relations.)
The physics major aside, size is the biggest reason I am interested in the economy’s balance sheet than I am in its GDP (its profit and loss statement.) Let’s look at how much bigger it is.
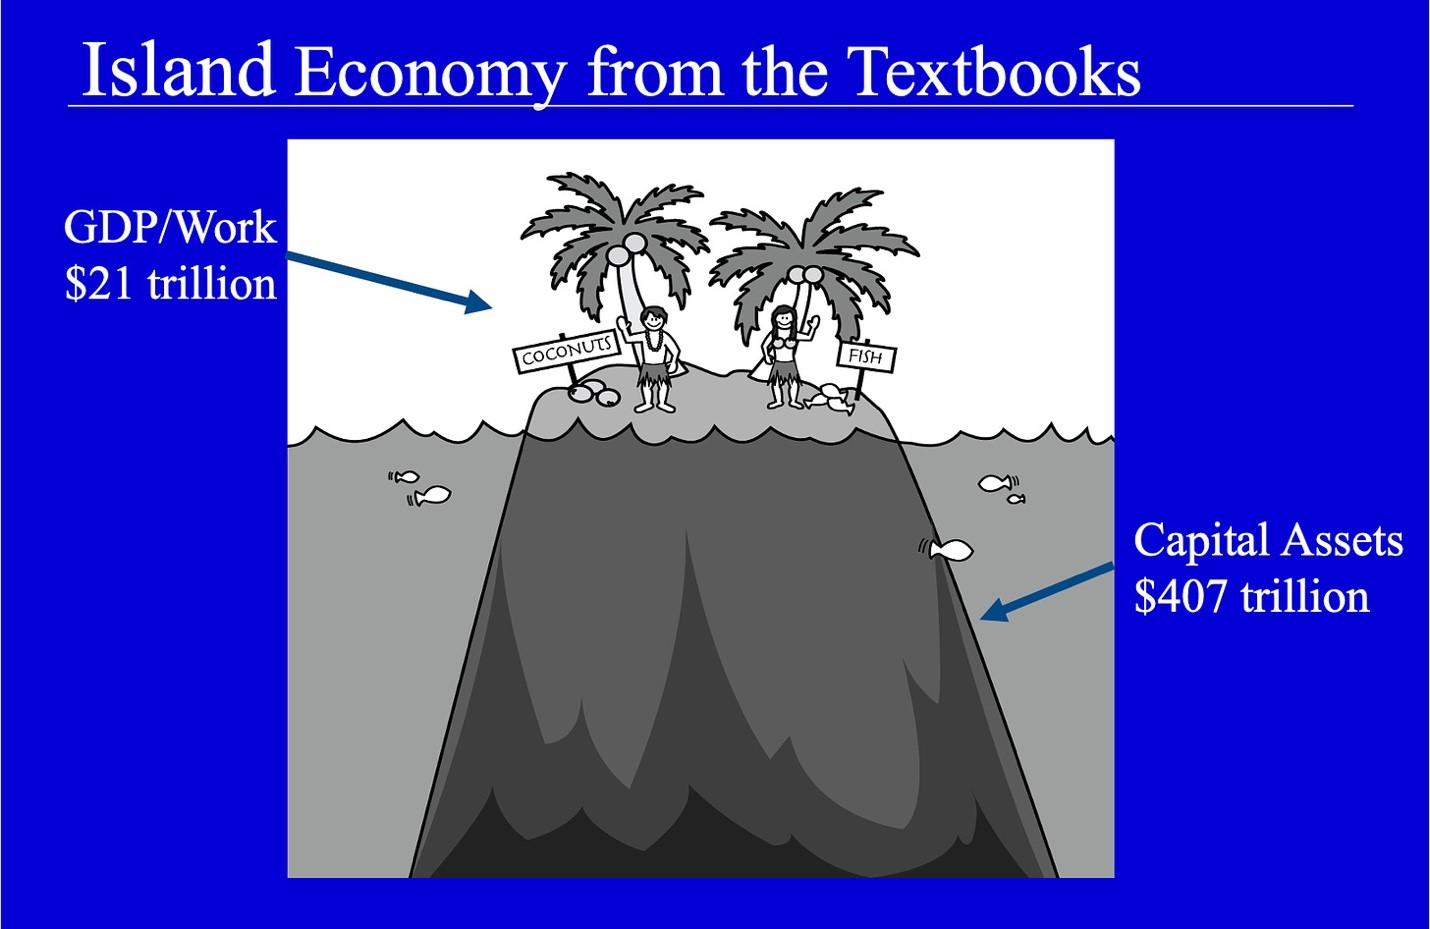
Every macroeconomics textbook starts by describing a macroeconomy as a circular flow of output and income with the story of two people living on an island economy. There are two principal economic activities on this island—picking coconuts and catching fish. The people may or may not choose to cooperate (trade) with each other; they may or may not choose to specialize in producing fish or coconuts. We can measure their aggregate economic activity by adding up how many fish and coconuts they produce during the year. (Economists would call it GDP; I prefer to call it Gross National Work (GNW)). To do so, we have to decide on a way to translate fish to coconuts, coconuts to fish, or both to a third unit of account (money). Economists like to do that by using relative prices arising when the people trade with each other. The result measures both GDP and income for this simple economy.
The island economy is a cute story and it’s simple to teach but it ignores one important fact. There wouldn’t be an island without the (hopefully dormant) volcano it sits on, supporting all the fishing and coconut activities the textbooks talk about. For an economy, of course, the volcano is its balance sheet housing the capital stock that makes production possible. At the end of 2020, the U.S balance sheet contained $407 trillion worth of assets, about 20x all the goods and services we produced during 2020. (Told you it was huge.) You can find the data on the balance sheet in the Financial Accounts of the United States – Z.1 published quarterly by the Federal Reserve Board.
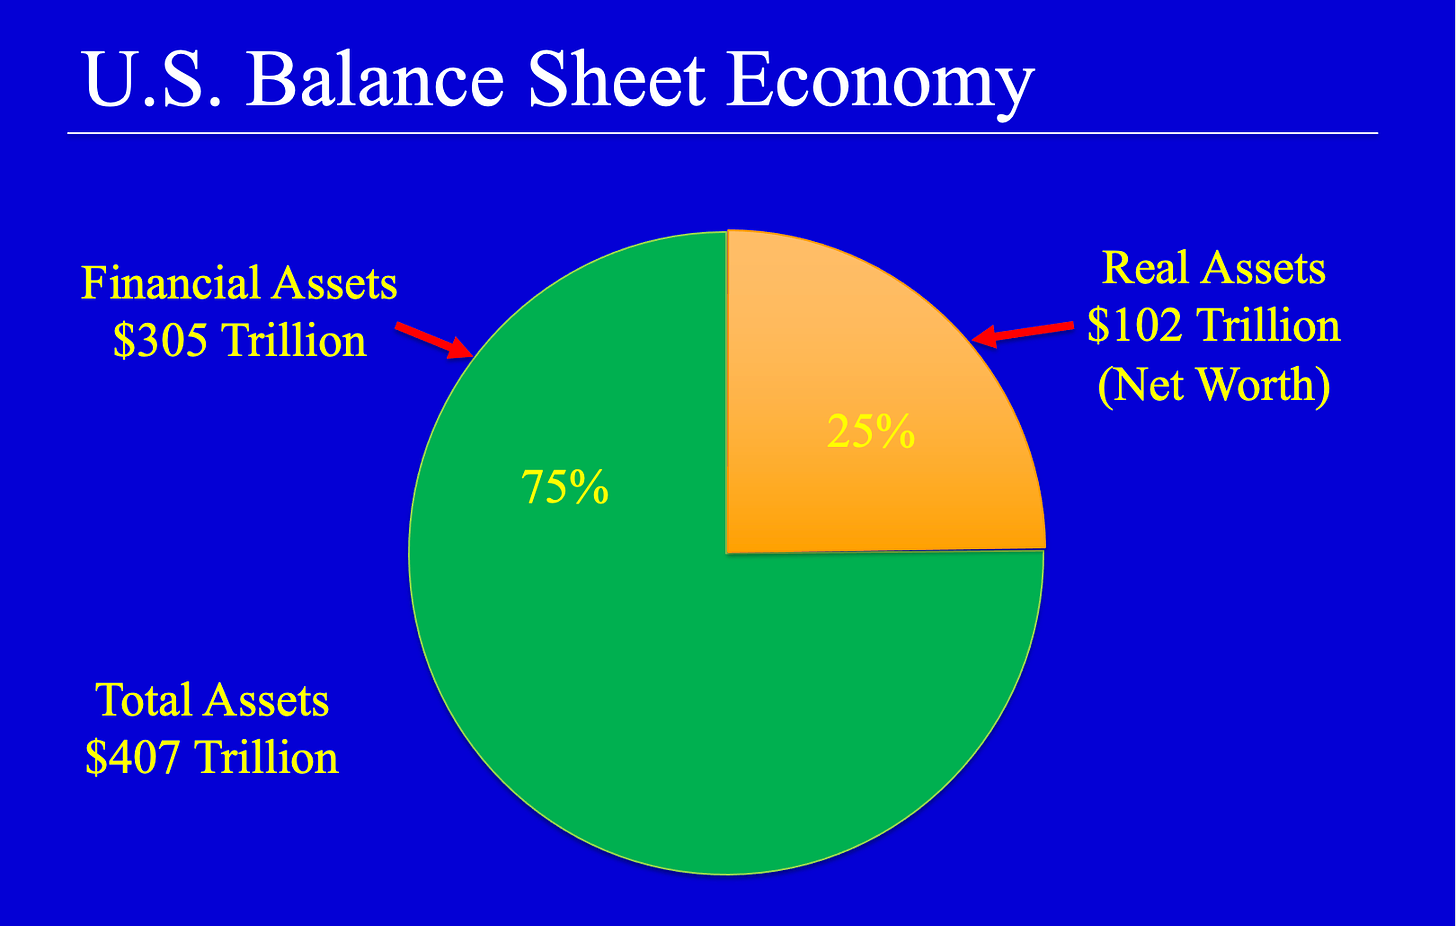
The asset side of the U.S. balance sheet as of 12/31/20 is pictured above. In all, it holds assets valued at $407 trillion. Tangible assets, like land, factories, machines, houses, used cars, paintings, jewelry, and gold bars make up 25% ($102 trillion) of our total assets. The other 75% ($305 trillion) is made up of bank deposits, Treasury bills, corporate and municipal bonds, commercial paper, and all the other paper assets that we own.
It’s important to point out that the $407 trillion figure does not measure our net worth. According to the same Z.1 report, the net worth of the U.S. was $114.5 trillion at the end of Q4/20. That’s because most paper assets have equal, offsetting liabilities. (Your IOU is my UOM). In the footnotes, you will see that they calculate the net worth figure by adding up the total value of tangible assets plus the value of corporate equity securities and subtracting net financial obligations to the rest of the world. So, tangible assets ($102 trillion) make up almost 90% of our next worth.
It is also worth pointing out that the Fed’s calculations exclude the value of all land owned by federal, state, and local governments. Once upon a time, the government published a document called “Balance Sheet of the United States,” which (properly) included government land holdings. Later, the Fed changed the definition to exclude land, calling it “land held in trust for future generations” in a footnote. I’m going to try the same trick with the IRS when I file this year’s taxes, leaving out any money I made by owning “land held in trust for my children” when calculating my income. Wish me luck.
Personal note: When I first started writing about this idea more than 40 years ago the numbers were a lot smaller. For illustration, my Wall Street journal Op-Ed, “Why Interest Rates Will Fall in 1982” that I showed you in last week’s Tangible Assets post reported that in 1981 total tangible assets were valued at just $7 trillion which, to put it in context, was equal to about two years of 1981 GDP.
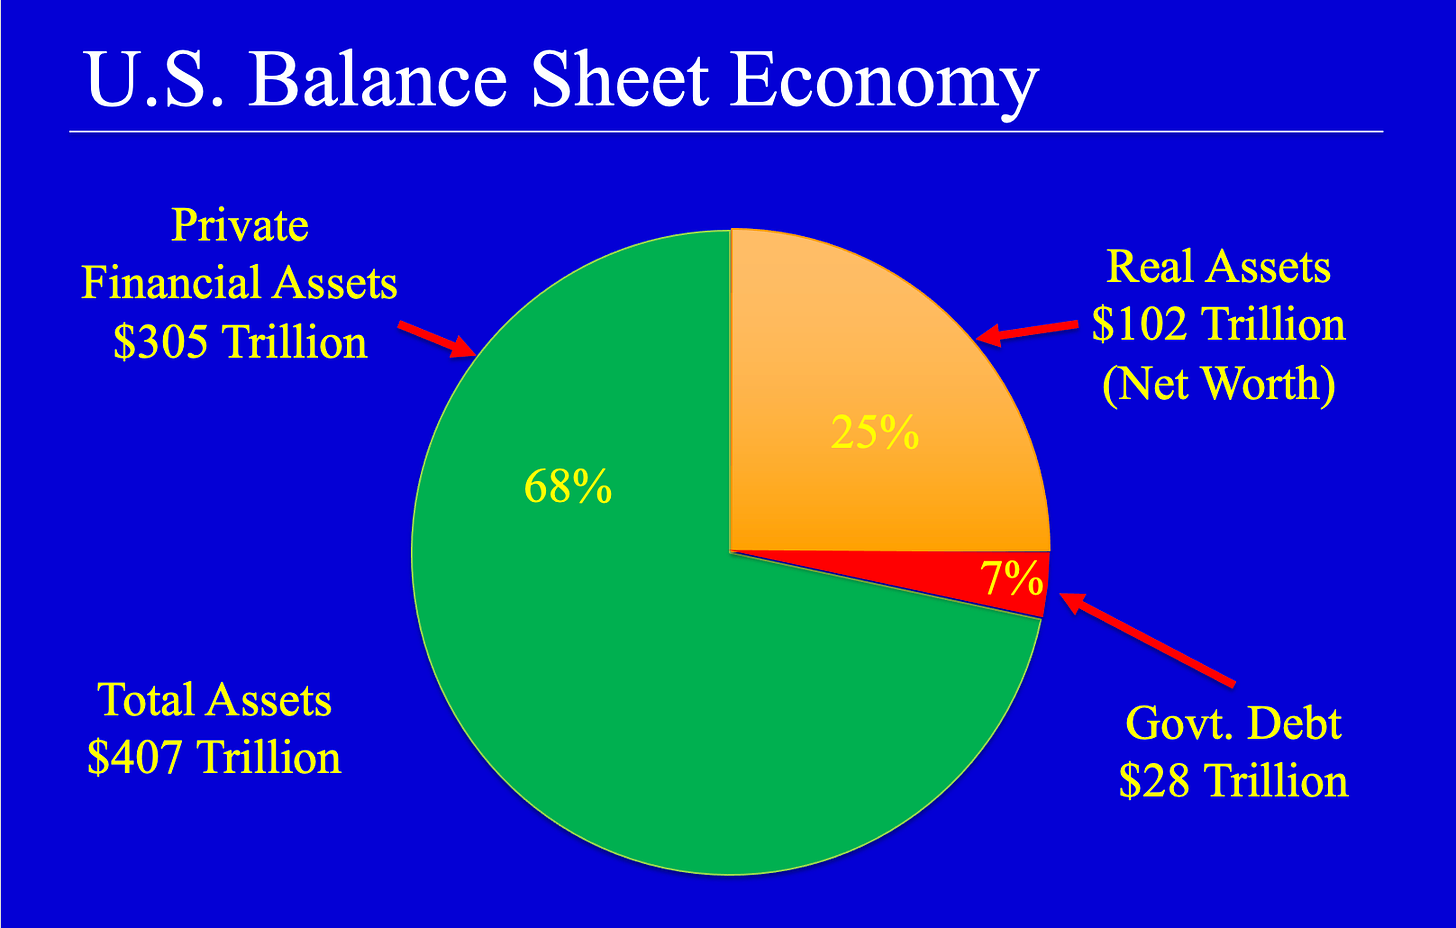
One last chart and I will let you go. The graphic, above, breaks out financial assets into privately issued pieces of paper and paper issued by the federal government, our $28 trillion government debt. As I argued in a subsequent Wall Street Journal Op-Ed, “The Structural Deficit Myth,” budget deficits don’t have much effect on interest rates because government debt makes up only 7% of total assets. I will write more on this later to help put recent spending and borrowing in perspective.
The reason I chose to slice up the balance sheet in this way is that economic policies have differential effects on the total returns of tangible and financial assets. In particular:
- Inflation (measured as the annual rate of increase of the price of tangible assets) directly increases the capital gains return on tangible assets but not on financial assets (This is why people call tangible assets “inflation hedge”) and
- Tax policy has historically treated gains on tangible assets much differently than gains on financial assets. (This is why people refer to tangible assets as tax shelters.)
Once you start thinking along these lines, knowing that people will react to policies that change relative assets yields by changing what they want to own, it forces you to reconsider a number of things including how to measure inflation, how to calculate real interest rates, and how to set monetary and fiscal policy. More on all that in a later post.
Meanwhile, think about it.
Dr. John
The views and opinions expressed in this article are those of Dr. John Rutledge. Assumptions made in the analysis are not reflective of the position of any entity other than Dr. Rutledge’s. The information contained in this document does not constitute a solicitation, offer or recommendation to purchase or sell any particular security or investment product, or to engage in any particular strategy or in any transaction. You should not rely on any information contained herein in making a decision with respect to an investment. You should not construe the contents of this document as legal, business or tax advice and should consult with your own attorney, business advisor and tax advisor as to the legal, business, tax and related matters related hereto.