
Goodbye Inflation. Hello Tribal Conflict

Summary: The headlines blasting the “hot” December CPI report were badly mistaken. After removing the inappropriate OER component, December CPI inflation was just 1.8%, below the Fed’s 2% target. Inflation and the Fed are about to move off the front page, to be replaced by a much more dangerous issue—the proliferation of tribal conflict that always follows plagues, pandemics, and other global natural disasters. That will be my focus going forward.
The Real Inflation Number is Hidden in Table 7
I find the most useful information in the monthly CPI report to be in Table 7 (below), which may be why the BLS doesn’t report it until page 30. Here are a few of the more important numbers to think about.
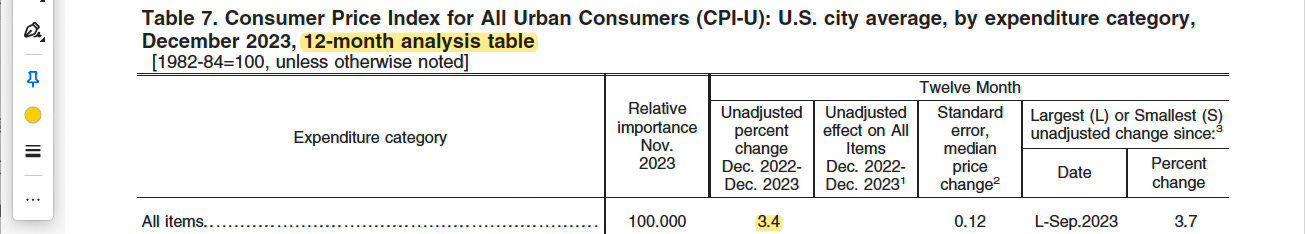
Figure 1: All items 12-month inflation, page 30
The first line in Table 7, above, (on page 30) shows the increase in the “All Items” CPI over the last 12 months as 3.4%. As reported on the front page of the report, shelter (housing) accounts for more than half of the increase, continuing a trend I have written about ad nauseam here, here, here, here, here, and here over the past year. (I’m just as sick of it as you are.)
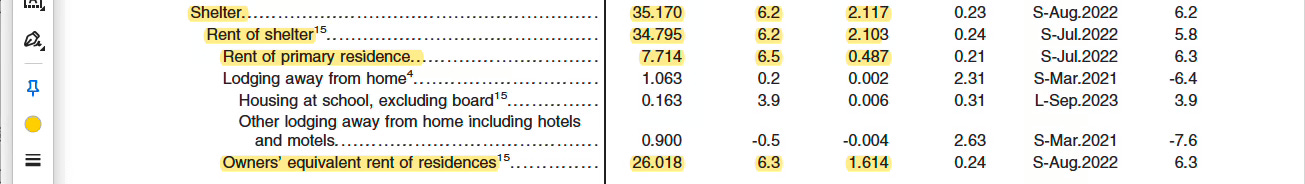
Figure 2: Shelter inflation, page 34
To see the shelter costs, you have to fight your way back to page 34, above. As I have written before, “Shelter” inflation, 6.2% over the 12 months ending in December, accounts for 35.170% of the value of the basket of goods and services used to construct the CPI and contributed 2.117% of the 3.4% increase in the CPI—that’s the “more than half” they were writing about on the front page.
Some of the subcomponents of the “Shelter” number are legitimate expenses. For example, “Rent of primary residence” makes up only 7.714% of the CPI and accounts for 0.487% of the increase in the “All Items” index, is a real expense because it measures the size of the checks that people who live in rental properties pay to the owners of those properties. Likewise, the checks people write to pay for their kid’s dorm room and to pay their hotel bills are legitimate expenses. The rest—”Owners’ equivalent rent”—is complete BS.
“Owners’ equivalent rent” (OER), which makes up 26.018% of the CPI, is an entirely fictitious number that claims to measure how much you would have to pay to rent the house you already own if you rented it from yourself. (Apologies for the long-winded description. Just wanted you to know that I am not making this up.) OER inflation contributed 1.614% of the 3.4% increase in the headline CPI.
For reasons I have outlined before, OER should not be in the CPI at all. If you were to remove it from the index, the 12-month inflation rate would be 3.4% – 1.614% = 1.786%, or about 1.8%, which is below the Fed’s much-advertised 2% inflation target.
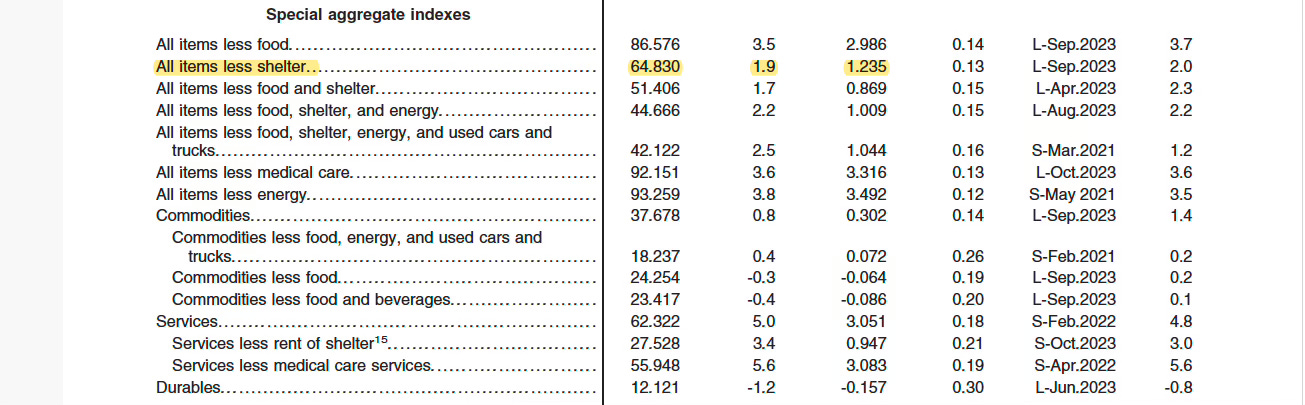
Figure 3: All items less shelter, Page 36
The closest the BLS gets to admitting this is in the Special Aggregate Indexes group on page 36, above, where they report that “All Items less shelter” inflation is just 1.9%, almost equal to the 1.8% figure we derived in the previous paragraph.
Bottom line: the December 12 month CPI inflation figure, properly adjusted by excluding imaginary OER numbers, was 1.8% per year, not 3.4%.
Couple More Things
Along with the OER problem, there are a few more things to keep in mind when you interpret the inflation reports.
- We all know that the FOMC prefers the PCE to the CPI as an inflation measure. (The December PCE report will be released January 26.) In general, my OER whining applies to the PCE report as well, although it’s worth keeping in mind that shelter has a smaller weight (about 15%) in the PCE. Click here to see a recent report from the San Francisco Fed showing that OER is the main driver of differences between CPI and PCE metrics. You can see a detailed reconciliation of the difference between PCE and CPI inflation by clicking here. In Q3/2023, the difference between 12-month PCE inflation (2.6%) and CPI inflation (3.6%) was entirely accounted for by OER (1.0%).
- I never use seasonally adjusted numbers to make decisions. All of the monthly numbers reported in both the CPI and PPI reports have been seasonally adjusted, which means adding a little to one month and subtracting a little from another month to make the numbers look more ‘normal,’ i.e., smooth. You might be wondering who gets to decide what is ‘normal.’ As you can read in the footnotes on page 7 of the CPI report, the adjustments are partly decided by a computer algorithm and partly by “intervention analysis,” a procedure where some economist at the BLS, whose name neither you nor I know, sees a number, thinks “Holy cow, that thing is huge” and decides to change it to what he or she thinks would be more ‘normal’ before using it to calculate seasonal adjustment factors. In the December CPI report, 57 of the 81 components of the CPI made use of intervention analysis. For these reasons, I always look at raw “unadjusted” data before making decisions. You can find the unadjusted data by fighting your way through the links on the BLS website. It’s worth the trouble.
- As I have argued before, the data produced just after going through a global pandemic should be taken with a grain of salt when making investment decisions. Until sufficient time has gone by to allow us to trust the data we use to make calculations—IMHO years, not months—we have no idea what ‘normal’ is. That means you should widen your confidence bands far beyond the ones you estimate from the historical data.
- Finally, I think that investors are starting to figure this OER thing out. In spite of the mistaken “hot” CPI headlines, the bond and stock markets both responded favorably. This is important because there are still a lot of OER distortions ahead of us. Shelter cost data are essentially magnified and delayed measures of rental costs; magnified because the ‘Shelter’ weight in the CPI (34.795%) is 4.5x what it should be to measure the money people actually spend on rent (7.714%); delayed because rent data reflects leases signed over the previous 12 months in different market conditions. We can see current market conditions by looking at the data provided by Zillow, Corelogic, and others about rent on leases signed over the past month—these numbers show that rents are falling today. As a result, some time in the next 12 months, OER data are going to drop sharply, which will make CPI inflation look lower than it should. That will produce misleading headlines about disinflation and help the Fed back away from the microphone to keep pushing rates lower in 2024.
Changing Topics
So, if inflation and the Fed are no longer the biggest risks to investors, what should we be worrying about? As I wrote a little more than a year ago, I believe our biggest risk is what I called The Real Long-COVID, the universal tendency of frightened people to “tribe-up,” accept autocratic leaders, and engage in conflict with out-groups in the years after plagues and pandemics. We can see that in Russia’s invasion of Ukraine, in the Israel/Palestine conflict, in the Houthi attacks on shipping in the Red Sea that increases the risk of direct confrontation with Iran, and in continued erosion of US/China relations. But most seriously, we can see it in the increasingly bitter internal divisions among U.S. voters that threaten to tear the country in two; I say most seriously because this is the one that threatens to derail the U.S. role in keeping all the other conflicts at bay. That’s why I have shifted my energy to trying to understand tribal conflict.
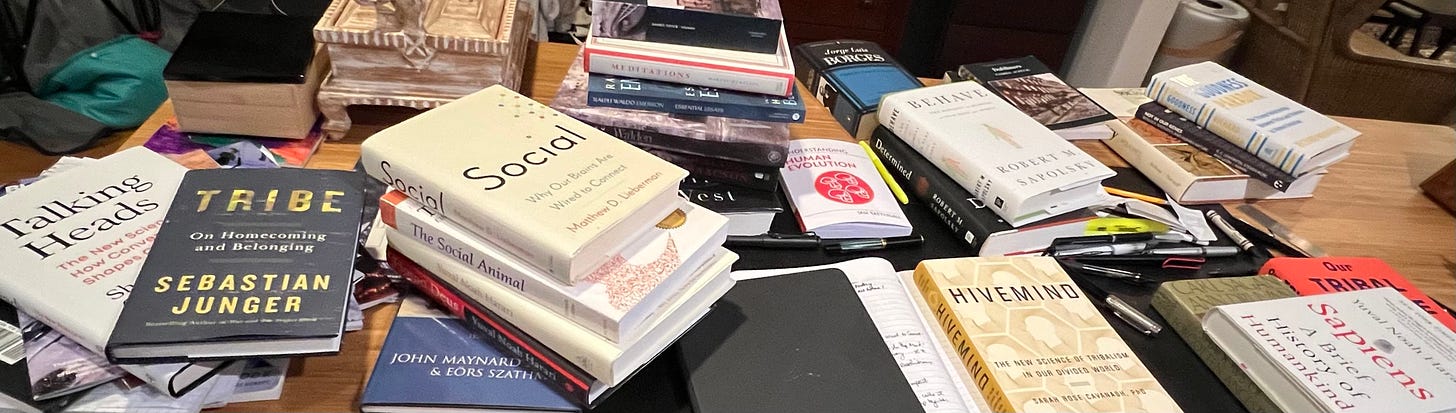
Figure 4: The books on my desk today
As you can see in the graphic, above, when I get into a topic I like to attack. The tribes pile on my desk includes books on the origin of life, genetics, cognitive science, paleontology, sociobiology, evolutionary anthropology, history, psychology, civil wars, information theory, conspiracy theories, philosophy, and complex systems. I build the pile by starting with a few of the books out of the many that I’m embarrassed I haven’t read yet, then drill down into the citations in the footnotes and references until I reach bedrock, i.e., they all reference each other.
Most of these books deal with different approaches to understand and manage complex systems. I have found my economics training to be inadequate for understanding these issues, likely due to its preoccupation with understanding the implications of so-called rational behavior of the individual. I have had much more success studying complex adaptive systems, an inherently multi-disciplinary approach associated with the Santa Fe Institute.
In any case, I will be shifting the focus of my writing to understanding and helping investors protect capital from the rising tide of tribal conflict. Stay tuned.
Dr. John
The views and opinions expressed in this article are those of Dr. John Rutledge. Assumptions made in the analysis are not reflective of the position of any entity other than Dr. Rutledge’s. The information contained in this document does not constitute a solicitation, offer or recommendation to purchase or sell any particular security or investment product, or to engage in any particular strategy or in any transaction. You should not rely on any information contained herein in making a decision with respect to an investment. You should not construe the contents of this document as legal, business or tax advice and should consult with your own attorney, business advisor and tax advisor as to the legal, business, tax and related matters related hereto.