
This is Not Stagflation

In Which: Dr. John Tells You to Ignore the stagflation hysteria. Last week’s inflation reports were not “hot.” March CPI Inflation was 2.6% (not 3.5%); PCE Inflation 1.9%, (not 2.5%). Stay Invested.
Dr. John Rutledge
Chief Investment Strategist
Summary: Newspapers and talking heads are wringing their hands about the “hot” March CPI inflation report—3.5% All-Items, 3.8% Core excluding food and energy—that made the Fed walk back expected rate cuts and triggered a selloff in bond and stock markets. But properly measured, by removing Owners’ Equivalent Rent (OER), Headline Inflation was 2.6%, and Core Inflation was 2.7%. Friday’s PCE report told the same story. Corrected All-Items PCE Inflation was just 2.1%, not 2.5%, and corrected Core PCE Inflation was just 2.3%, not 2.8%.
Market rents on newly signed leases are falling, not rising. This will push even official (uncorrected) inflation figures below the Fed’s target in the second half of this year, prompting another surprise Fed about-face and declining rates. That and improved Q2 earnings numbers mean we should treat recent market weakness triggered by inflation fears as a buying opportunity.
Fed Open Mouth Operations
There are two problems with Fed policy. One problem is they talk too much; the other is they do the wrong thing. Both are destabilizing for financial markets.
Federal Reserve Open Mouth Operations—the tsunami of speeches and press conferences our self-aware Fed Governors and regional bank presidents use to tell us how they think—have become a major source of instability for financial markets. It is fine for the Fed to tell us they are targeting 2% inflation and it’s fine to remind us on occasion that they really mean it. But it is foolish for the Fed to publish detailed forecasts of individual FOMC members divinations and to use the speeches of Fed officials to give coordinated, barely disguised, hints of impending policy changes.
What they do is causing a different kind of trouble. But failing to admit the OER bias in official inflation metrics and failing to allow for well-known lags between policy changes and inflation are keeping interest rates too high for too long.
Shelter Costs Distort Official Inflation Figures
For reasons I have outlined before, the official CPI index overstates the importance of housing costs by a factor of five and overstates so-called Core Inflation by an even larger factor.[i] As a result, sharp adjustments in market rents, like the ones we experienced during and after the COVID pandemic, significantly distort inflation measures, which can lead to costly policy mistakes. Below are reasons why the Fed is making one today.

The first reason is that housing is the only meaningful inflation taking place, even in the official statistics. As the chart above from the Financial Times shows, the bulk of the inflation we experienced during and after COVID, driven by supply chain interruptions and government stimulus dollars, has now washed through the numbers with one glaring exception—shelter costs (the pink bars in the chart) that are dominating today’s CPI numbers. According to the CPI report, “The shelter index increased 5.7% over the year, accounting for over 60% of the total 12-month increase in the All items less food and energy index.”

Source: March CPI report
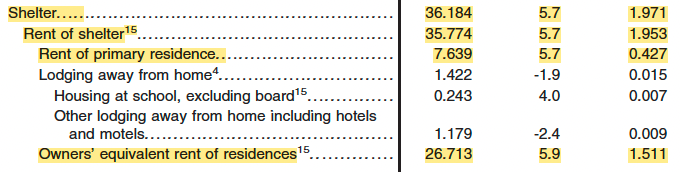
As you can see in the table, above, Housing makes up almost half (45.1%) of the market basket the BLS uses to calculate the CPI. The lion’s share of that is Rent of shelter (35.7%) which, combined with its high inflation figure (5.7%), gives Housing a disproportionate impact on the CPI. As shown in the right-hand column, Housing was responsible for 2.07% of the 3.5% inflation number for the total index, i.e., the 12-month inflation rate for everything except housing was just 3.5% – 2.07% = 1.43%, well below the Fed’s 2% inflation target.
But that’s going too far; it would not be appropriate to exclude all Rent of shelter costs when measuring inflation. About one-fifth of that number, called Rent of primary residence (7.6%), represents actual checks written to actual landlords to pay actual rent for living in actual apartments, condos, or houses. (Actually, I apologize for the abundance of “actuals”, but you will see below why they are necessary.) Rent of primary residence belongs in the index. The same goes for the cost of hotels motels, and your kid’s dorm room.
What doesn’t belong in the index, however, is Owners’ equivalent rent of residences(OER) that has a whopping (26.7%) weight in calculating the overall CPI. There are two things to know about OER. First, it is not an actual expense, i.e., there is no person paying money to another person here. Instead, it is an entirely made-up number that purports to measure what the owner of a house—even an owner who owns their home free and clear with no mortgage to pay—would have to pay to rent their own home from themself. The BLS then counts the imaginary payment as a personal consumption expenditure, and the imaginary receipt as personal income, offset by any mortgage payment and another imaginary charge for depreciation, while making no allowance for capital gains or losses.
Second, because the rental payments never actually take place, there is no actual data to collect to measure them. You may have noticed that, in the monthly CPI reports, the inflation figures for Rent of primary residence and OER are suspiciously similar. That’s because the BLS uses the same Rent of primary residence data they collected to measure what actual renters pay to actual landlords plus various qualitative adjustments to reflect the fact that an apartment in a neighboring town is not actually your house. Due to the relative weights, I outlined above, this effectively inflates rent checks by a factor of 5 to turn them into an estimate of OER.
Are you still with me?
Twin Policy Errors
So, why does this matter? In normal times, when there are neither pandemics nor massive bailout checks in the mailbox, it wouldn’t matter much because the cost of renting an apartment (therefore OER) rises at about the same rate as the rest of the CPI index. For example, from the beginning of COVID, in January 2000, until March 2024, the average annual CPI inflation rate (4.54%), OER inflation (4.73%), and my calculation of CPIXOER (CPI inflation excluding OER) (4.48%), were almost identical, which makes the OER bias I described above just six basis points (4.54 – 4.48% = 0.06%) since the beginning of COVID. But a look at its time path reveals its role in committing two very big policy errors.

Inflation rates for 1) All items CPI and 2) All items CPI excluding OER
The chart above plots two measures of inflation since the beginning of COVID in January 2020. The blue line measures CPI, the annual rate of change of the All-items CPI index, which many writers call Headline inflation. The orange line measures CPIXOER, my calculation of the annual rate of change of the All-items CPI index excluding OER, which I earlier referred to as Corrected Inflation.
In the early days of the pandemic—roughly the left half of the chart—the official CPI (the blue line) rose more slowly than CPIXOER (the orange line), reflecting the well-known fact that it takes a year or more for BLS rental data to reflect changes in market conditions because a large share of apartments only renew leases every 12 months.[ii] During this period official reports (CPI) failed to report the full increase of inflation (CPIXOER), the Fed gave speeches that inflation was transitory, and they kept rates too low for too long.
All that changed, of course, in the right half of the chart. After mid-2022, improved supply chains began to pull CPIXOER lower, but CPI reports failed to register the drop due to the sluggish rental data problem described in the previous paragraph. As a result, CPI systematically overestimated inflation during all of 2023, which convinced the Fed that inflation was ‘sticky’, and that they should keep rates high.
Inflation Will Continue to Decline
Reported inflation (CPI) will continue to fall over the next year for both technical and analytical reasons. The technical reason is straightforward. The most recent CPI report shows rents increasing at a 5.8% annual rate over the past 12 months, but we know that leases are currently being signed at or below their dollar levels of a year ago. As the year progresses, the new lease rates will gradually pull the official rental inflation data lower every month, which will push OER inflation from last month’s 5.8% level to approximately zero.


The analytical reason is that it takes time for changes in Fed policy to show up in inflation rates. In a recent research report, economists at the Federal Reserve Bank of San Francisco attempted to measure the impact of a one percentage point increase in the Fed funds rate on inflation rates for the 136 goods and services categories that collectively make up headline PCE inflation. The charts show their results for categories that are Most responsive and those that are Least responsive to policy change.
Their estimates show, in the left-hand chart, that the inflation rate for the Most responsive group (which includes air transport, financial services, hotels…) has already fallen below the Fed 2% target, but the Least responsive group (which includes Housing, Pharmaceuticals, Health insurance…) is just starting to decline. The right-hand chart shows that the lagged effects of the rate hikes that began in March 2022 will continue to push inflation lower for at least the next two years. Today’s interest rates will not support bank balance sheets and existing home prices at current levels. At some point along the way, the Fed will be forced to wake up and smell the coffee and begin to lower rates.
So, What Does This Mean for Investors?
My conclusion from this analysis is that the Fed and most market observers will continue to overreact to every piece of inflation news and every Fed press conference by pushing interest-sensitive stock prices sharply lower each time, as they did after the March CPI report, the Q1 GDP report, and the PCE report. For a patient investor, each of those will be a shopping opportunity to use some of that cash you have been holding to buy shares of the best companies at lower prices.
As always, I welcome your comments.
Dr. John
[i] Shelter costs carry a 36.2% weight in the official All-Items CPI index. Three-quarters of that figure represents OER, imagined rent that nobody pays to anybody. Actual rent that renters pay to owners—the figure that should be used to represent shelter costs, makes up just 7.6% of the index. As a result, the official index overstates shelter costs by 36.2 / 7.6 = 4.7 times.
Shelter costs overstate so-called Core Inflation—All Items excluding food and energy—by even more. Core inflation makes up 79.8% of the All-Items index, which means that Shelter costs carry a weight of 36.2 / .798 = 45.4% in the Core Inflation index. As a result, core official inflation figures overstate shelter costs by 45.4 / 7.6 = 6.0 times, leading to wild swings in the official inflation measures when market rents move sharply up or down.
[ii] Fed Chairman Powell and others have referred to the fact that it takes rental data a full year to reflect currently signed new leases as a flaw. I disagree. I would like the current rental payment data point to measure the size of the actual check that a renter sent to the landlord this month, not “current market conditions.” If this month one pout of twelve renters signed a new lease at a higher rent than their previous lease that means the other eleven out of twelve renters did not sign a new lease this month and will pay the same rent, they did the previous month. This reflects my preference that a measure of consumer prices, like the CPI, should attempt to reflect out of pocket expenses, not hypothetical expenses like OER.
The views and opinions expressed in this article are those of Dr. John Rutledge. Assumptions made in the analysis are not reflective of the position of any entity other than Dr. Rutledge’s. The information contained in this document does not constitute a solicitation, offer or recommendation to purchase or sell any particular security or investment product, or to engage in any particular strategy or in any transaction. You should not rely on any information contained herein in making a decision with respect to an investment. You should not construe the contents of this document as legal, business or tax advice and should consult with your own attorney, business advisor and tax advisor as to the legal, business, tax and related matters related hereto.