
Bad Data: The Case of the Consumer Price Index

Summary: Misled by bad inflation data, the Fed raised rates too high, too fast, and drove the banking system to the brink of a credit crisis. This post examines focuses on one of the principal sources of bad data, an important flaw in the Consumer Price Index. Last week, the headlines told us that consumer prices rose 4.9% over the 12 months ending in April, too high for the Fed to stop raising rates. But almost half of the increase can be traced to the 8.1% rise in “Owners’ Equivalent Rent” (OER), an entirely made-up number that claims to measure the cost of shelter for people who own their own homes. OER makes up 25.4% of the market basket of goods and services that the Labor Department uses to calculate the CPI.
In this post I explain why Owners’ Equivalent Rent is a flawed concept and argue that it should be removed from the index. Doing so would have made the April CPI inflation number just 2.9%, within reach of the Fed’s 2% target, sparing both the most recent rate hike and the next failed regional bank.
Dancing in the Dark
Active COVID cases are no longer front page news and supply lines are rapidly returning to normal but we will be dancing in the dark for some time, trying to understand the structural damage done by the pandemic to our economy, our political system, and our lives. Some of that damage is easy to see—a million lost people and grieving families, kids who didn’t learn math because they couldn’t go to school, a shrunken labor force, a smaller capital stock, and a larger national debt. Some is less visible but just as important, like permanently heightened levels of fear and the loss of faith in our institutions and in each other that I have described as the Real Long COVID.
Today I am going to write about a third category of damage, the loss of integrity of the data we use to make decisions. Procedures for collecting, processing, and analyzing economic data were designed for normal times. But once-a-century pandemics are not normal times. Data designed for normal times can be misleading during and after a cataclysmic event like the pandemic.
Before you decide (discover?) I’m just a grumpy old man, I want to make it clear I’m not impugning the work of the data miners at the BLS, the BEA, and the Fed or suggesting that I could do it better. Providing real-time metrics for an economy that is a living, breathing complex system going through violent change is an almost impossible job. My point is that we should pay special attention to the reliability of incoming data before we make major decisions.
Unquestioning acceptance of bad data played an important role in the Fed’s twin blunders, leaving interest rates too low, too long, then raising interest rates too high, too fast. These mistakes set the stage for the avalanche of regional bank failures that has tightened lending standards and left the economy on the edge of a major credit crisis.
Shelter Cost Grossly Overweighted in the CPI
The main culprit is the Consumer Price Index. The treatment of rent and shelter costs in the CPI grossly overstates the impact of housing costs on inflation. Not for the reasons Chairman Powell used in his press conference—slow moving lease contracts—but because there is a conceptual error in its construction.
The weights in the market basket used to construct the CPI include both the legitimate 7.5% weight for the cost of rent paid by people who rent their primary residence and an additional “imputed” 25.4% weight known as “Owners’ Equivalent Rent of Residences” (OEM), making the total weight for shelter costs a whopping 34.5% in the overall CPI. Correcting this error would have reduced the 4.9% April CPI inflation figure to 2.9% and the FOMC may well have foregone the additional quarter point rate hike at their April meeting. I review the details below.
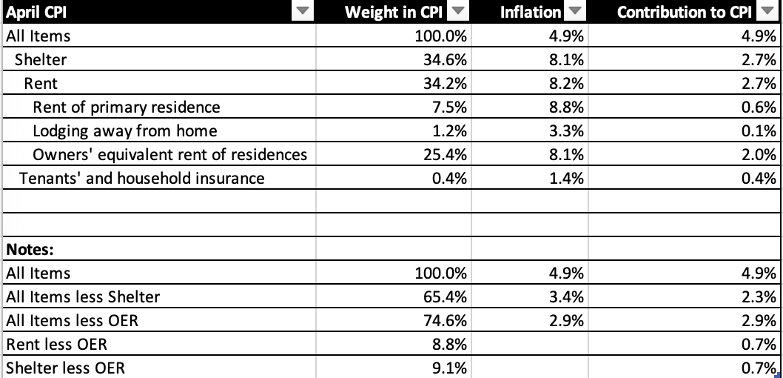
The graphic, above, contains figures from the April CPI report along with calculations I have made to illustrate my point. The top row shows that the All Items CPI makes up 100% of the index (I know, duh!), and that it increased by 4.9% during the twelve months ending April 2023, which accounted for 100% of All Items inflation. The other rows are selected sub-categories.
As you can see, shelter accounts for a whopping 34.6% of the market basket used to construct the CPI. Because its weight is so large, shelter inflation (8.1%) is responsible for 2.7%, more than half of April’s 4.9% increase. This implies that everything else in the index (the All items less shelter row in the table) only accounted for 2.3% of overall inflation.
The weight for shelter (34.6%) is made up of a large Rent (34.2%) component plus (0.4%) for Tenants’ and household Insurance.
Rent (34.2%) is broken down into subgroups, 1) Rent of primary residence (7.5%) which represents the rent paid by people who rent their homes, 2) Lodging away from home (1.2%), and 3) Owners’ equivalent rent of residences, OER, which makes up more than a quarter (25.4%) of the overall index.
Owners’ Equivalent Rent is the Problem
Here is the problem. Owners Equivalent Rent is an entirely fictitious number invented by the BLS to measure the price of market transactions that never happened. There are no transactions to report because owners don’t rent their homes from themselves—they already own them. OEM is for the purpose of guessing what owner-occupied houses might rent for if their owners had to rent them. Unlike other components of the CPI, it does not represent the result of surveys of market prices; it is created by manipulating the data they collect on the (7.5%) of residences, typically apartments, that are actually rented.
So why is it there? The tortured logic at work here is a good example of what happens when an economist confuses stocks of assets (owning a house) and flows of goods and services (renting a house).
OEM owes its inclusion in the market basket used to construct the CPI to a corruption of the economist’s concept of opportunity cost, supposedly standing in for what owners would have to pay as rent to live in their own house if they didn’t own it. In other words, imaginary rent.
In fact, the owners do own their house. If the owners were to rent their own house, they would have to do so from themselves, in which case they would both pay the rent as tenant and receive the rent as owner of the house for a net cost of zero. The owner has already purchased a lifetime supply of house services the moment they bought the house, hedging their future stream of shelter costs. The value of that asset now shows up as an asset on their balance sheet.
There are two caveats I should mention. One is that people living in their own homes do experience various costs for maintenance, repairs, utilities, and taxes. These are legitimate costs and, to the extent they are not already accounted for elsewhere in the index, should are included in the CPI, at the appropriate (much smaller) weight. The second is that there is a legitimate opportunity cost to think through. To buy the house, the owner either sold assets that would have otherwise produced income, or borrowed funds (mortgaged the property), in which case the interest on the mortgage is a measure of opportunity cost. But both these are balance sheet matters, not current purchases of goods and services. They don’t belong in the index.
Conclusion
The bottom line is that OEM should be removed from the index. It should be replaced with any actual out-of-pocket costs of maintaining a home that are not already accounted for in the index, with a weight appropriate to their much smaller size. After removing OER from the April index, the remaining items in the market basket had an inflation rate of just (2.9%) per year, not that far above the Fed’s 2% target rate. To the extent the maintenance costs I described above were greater or lower than 2.9%, the new inflation figure would be slightly higher or lower than 2.9%. Recent evidence on commodity prices, goods prices, and labor costs suggest we have a good chance of seeing our corrected inflation figure fall below 2% by yearend.
Some Thoughts for Investors
If I am correct in my claim that the Consumer Price Index overstates inflation by approximately 2%, what does that imply an investor should do? The first thing is to admit that you, dear reader, and I are the only people who know this. Certainly the Fed does not think this way or they wouldn’t have jacked rates up so fast. It’s also clear that the child journalists asking Chairman Powell questions at the FOMC press briefing don’t know this or they would have asked him pointed questions about it. And I would judge from the stock and bond market reactions to the FOMC statement that they don’t get it either. So what do we do with information that no one else believes?
To the extent that my analysis is correct, it implies that interest rates today are too high for the current inflation rate. The fact that the Fed does not know that means they are likely to attempt to keep rates too high for too long, slowing growth and pushing inflation still lower, then grudgingly lower rates once their faulty CPI data shows that falling rents have pulled shelter costs and the overall index lower. I say attempt because the market has a way of helping the Fed change its mind by accelerating change, as recent behavior in the bond market may be doing now. That gives us advance notice of a period of falling interest rates and rising interest-sensitive stock prices later this year and next.
The biggest risk, as I wrote last week, is the possibility that the Fed’s current too-tight policy leads to more bank failures and a credit crisis in the next few months. That means we need to hold a significant share of a portfolio in cash or in investment vehicles that prosper in times of tight credit until the Fed shows they are on a path to lower rates.
As always, I welcome your comments, questions, and suggestions for next topics.
Dr. John
The views and opinions expressed in this article are those of Dr. John Rutledge. Assumptions made in the analysis are not reflective of the position of any entity other than Dr. Rutledge’s. The information contained in this document does not constitute a solicitation, offer or recommendation to purchase or sell any particular security or investment product, or to engage in any particular strategy or in any transaction. You should not rely on any information contained herein in making a decision with respect to an investment. You should not construe the contents of this document as legal, business or tax advice and should consult with your own attorney, business advisor and tax advisor as to the legal, business, tax and related matters related hereto.